Cameron Beck · 3 November 2026
Electric Buses and River Health: Varlow's Dual Approach to Sustainability Challenges
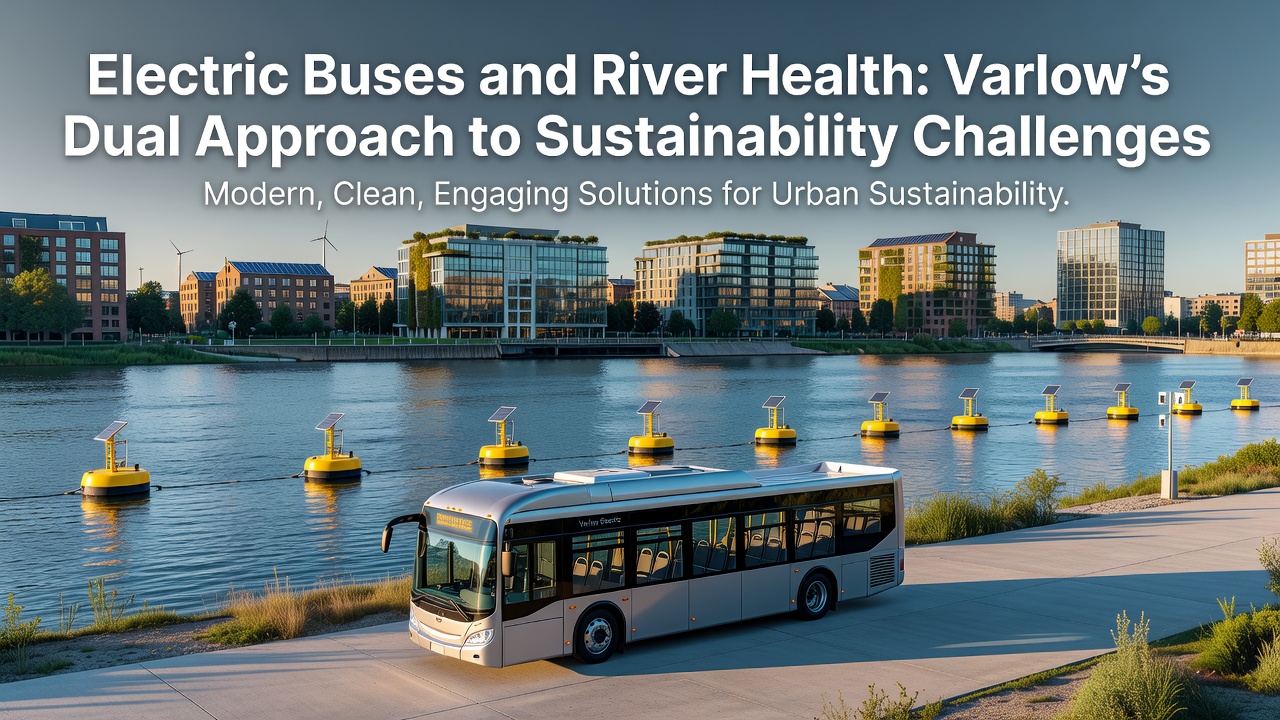
Varlow has launched coordinated programs that pair electric bus fleet expansion with targeted river health interventions, and these efforts address transportation emissions alongside water quality concerns in the same geographic area. Local authorities report that the dual strategy emerged from data collected between 2023 and 2025 showing elevated nitrogen levels in the Varlow River coinciding with increased diesel bus routes along the waterfront corridor.
Electric Bus Fleet Expansion Details
The city council approved procurement of 142 electric buses in late 2025 with deliveries scheduled through November 2026, and operators have already placed 48 vehicles into service on routes that previously relied on diesel models. Charging infrastructure includes 12 depot stations plus three on-route fast chargers positioned near the riverfront terminal, which reduces the need for additional grid connections that might affect nearby stormwater systems. According to transit department logs, the electric fleet has logged over 1.2 million kilometers without tailpipe emissions, while diesel displacement figures indicate an estimated 890 metric tons of nitrogen oxides avoided during the first nine months of operation.
River Health Monitoring and Restoration Measures
Parallel river initiatives focus on three tributaries that feed the main channel, and crews have installed 27 continuous water quality sensors that transmit data every fifteen minutes to a central dashboard. Restoration work includes removal of 4.8 kilometers of invasive vegetation along bank edges plus the addition of 1,200 native riparian plantings designed to stabilize soil and filter runoff. Researchers from the regional environmental institute documented a 14 percent drop in total suspended solids at two downstream sampling points after the first planting season concluded in 2025.
Integration of Transportation and Water Programs
Planners aligned bus route adjustments with riverbank construction schedules so that temporary lane closures would not coincide with heavy equipment movements near sensitive stream crossings. This coordination prevented additional sediment disturbance during sensor installation phases, and traffic modeling showed that rerouted electric buses maintained average speeds within two percent of baseline diesel performance. Observers note that shared data platforms allow transit managers to adjust schedules when river sensors detect spikes in conductivity that might indicate road salt runoff from winter maintenance activities.
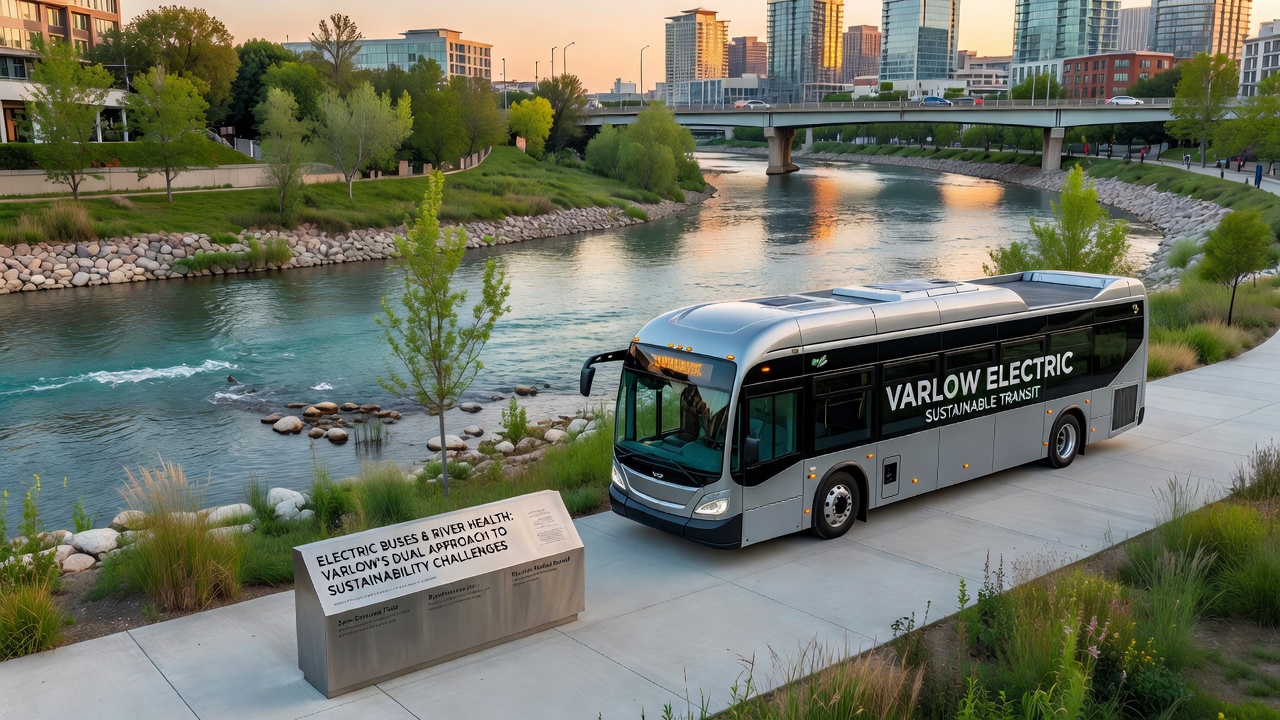
Funding streams combine federal transportation grants with state water quality allocations, and the blended approach covers both capital purchases and ongoing monitoring costs through 2028. City documents list projected annual operating savings of $1.4 million from reduced fuel and maintenance expenses on the electric fleet, while river restoration contracts allocate separate line items for vegetation management and sensor calibration. Those who track municipal budgets point out that the combined projects draw from distinct revenue sources yet share a single public reporting portal that updates progress metrics monthly.
Data Sources and External Benchmarks
Performance indicators draw from standardized protocols used by the U.S. Environmental Protection Agency for water quality assessment, and transit metrics follow reporting templates developed by the International Energy Agency for electric vehicle fleets. A 2024 study released by the University of Melbourne examined similar paired interventions in comparable mid-sized cities and found that synchronized planning reduced overall project timelines by an average of 11 months. Figures from the Australian Department of Climate Change, Energy, the Environment and Water provide additional context on riparian buffer effectiveness when paired with low-emission public transport corridors.
Implementation Timeline Through Late 2026
Phase two of the bus rollout begins in March 2026 with 62 additional vehicles entering service, and riverbank stabilization crews will complete the final 800 meters of native planting by the same month. Sensor networks will expand to include two upstream reference sites before November 2026, allowing year-over-year comparisons across the full watershed. Maintenance protocols for electric buses now incorporate winter weather adjustments that account for potential road treatment impacts on river conductivity readings, and operators receive weekly briefings that incorporate both fleet performance data and water quality alerts.
Conclusion
Varlow's programs demonstrate how separate infrastructure domains can operate under unified scheduling and shared data systems without merging their distinct regulatory requirements. Continued monitoring through the end of 2026 will supply additional datasets on emission reductions and water quality trends, while the existing sensor array and fleet telematics already generate comparable metrics for both initiatives. The approach relies on existing funding mechanisms and established technical standards rather than new regulatory frameworks.